 WHMCS
WHMCS Zoho Desk
 Google Analytics
 Tawk.to
 LiveChat
Central Platform for your scattered data
Bring scattered data from everyday tools to a central platform through simple easy data source connectors.
Connect your everyday tools to InsightDials and easily monitor, analyze, and gain insights on your scattered business data.
Sign Up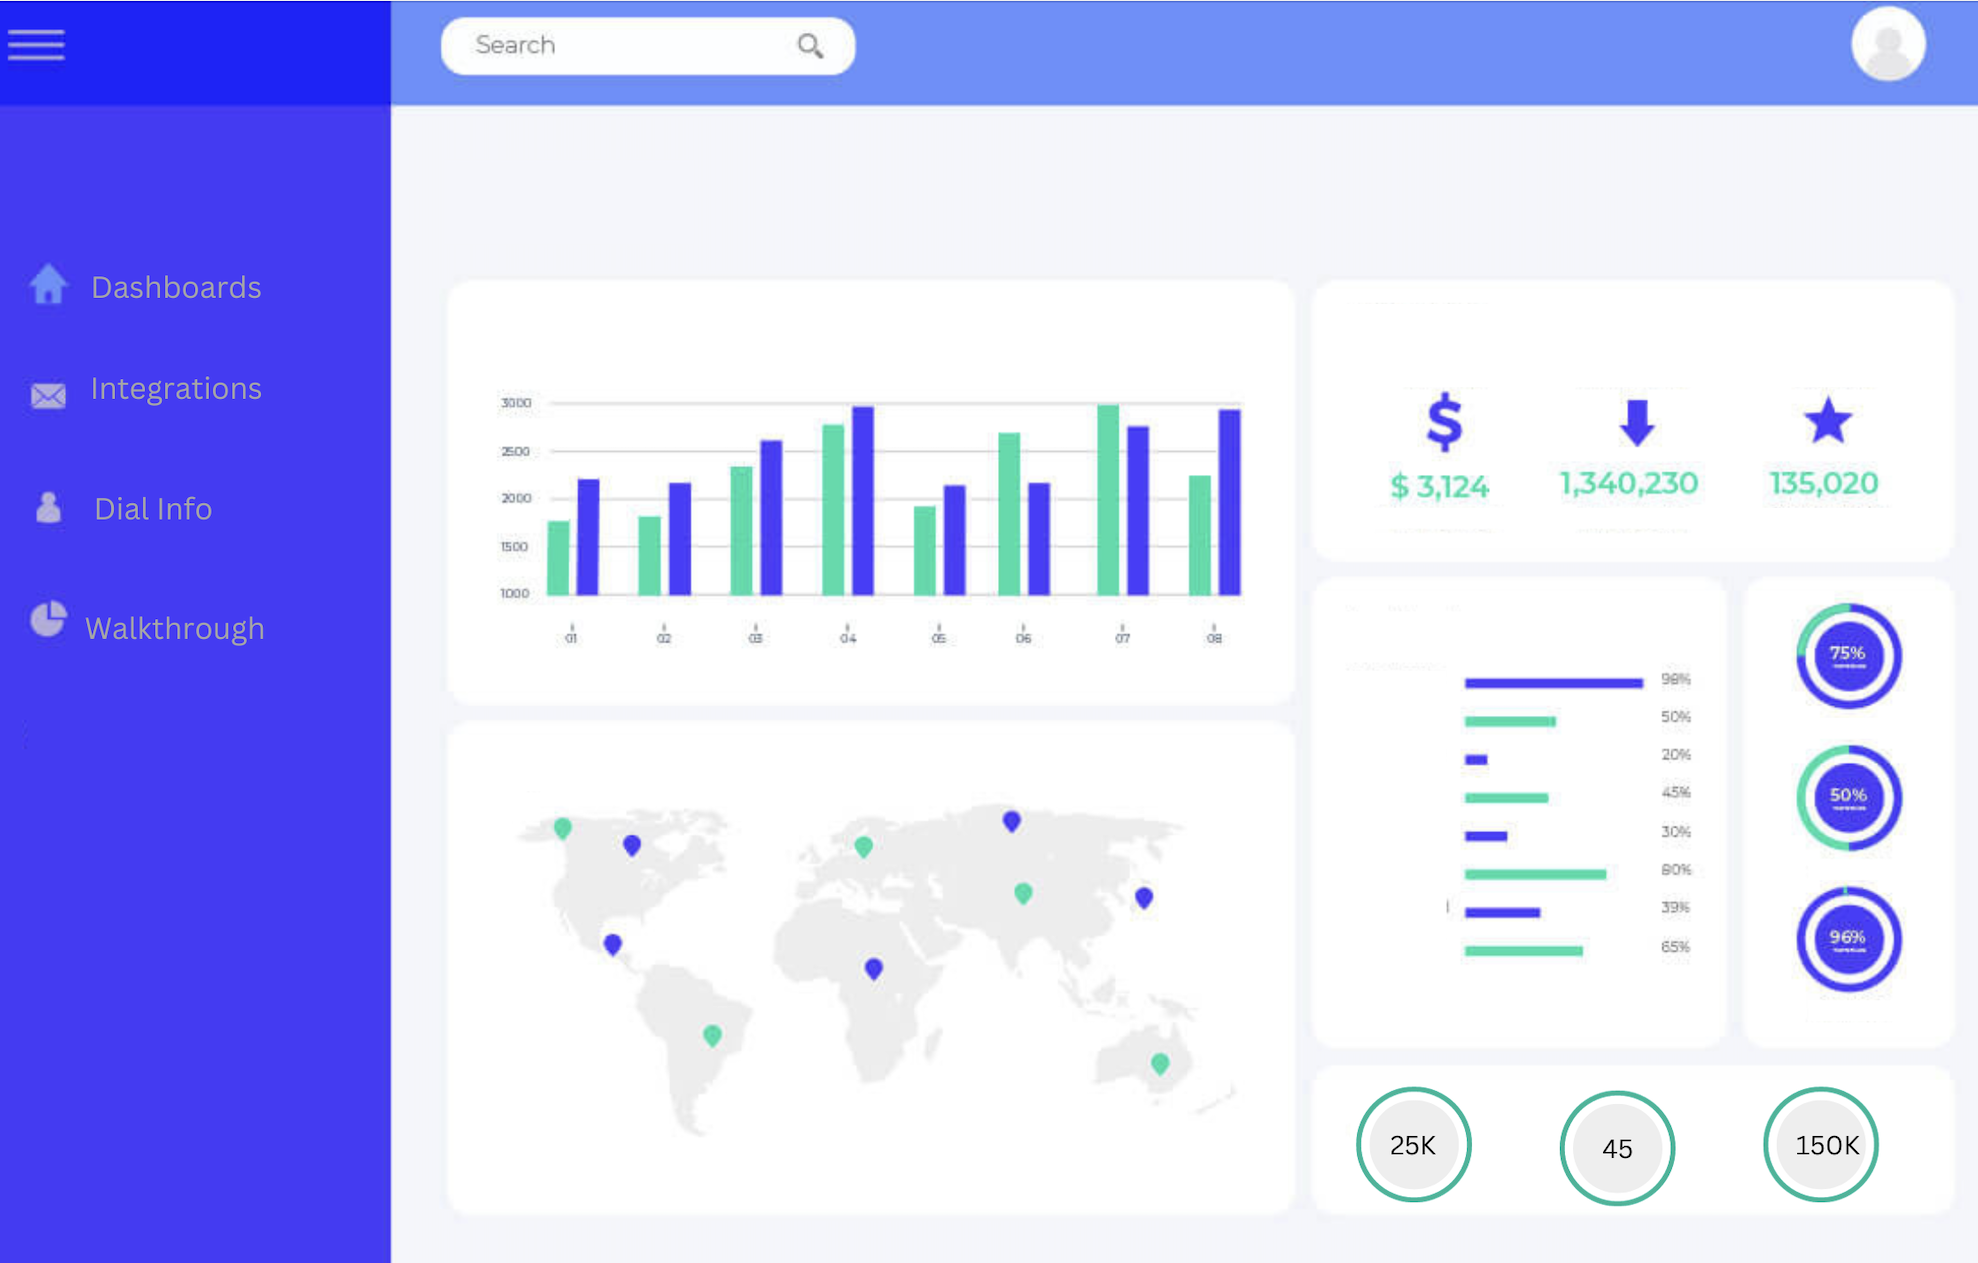


Set it up once, and you're good to go. No hassle or coding required.
Say goodbye to complex data analysis. Simplify business intelligence with InsightDials.
Explore your data in greater depth and find answers to your hows and whys.
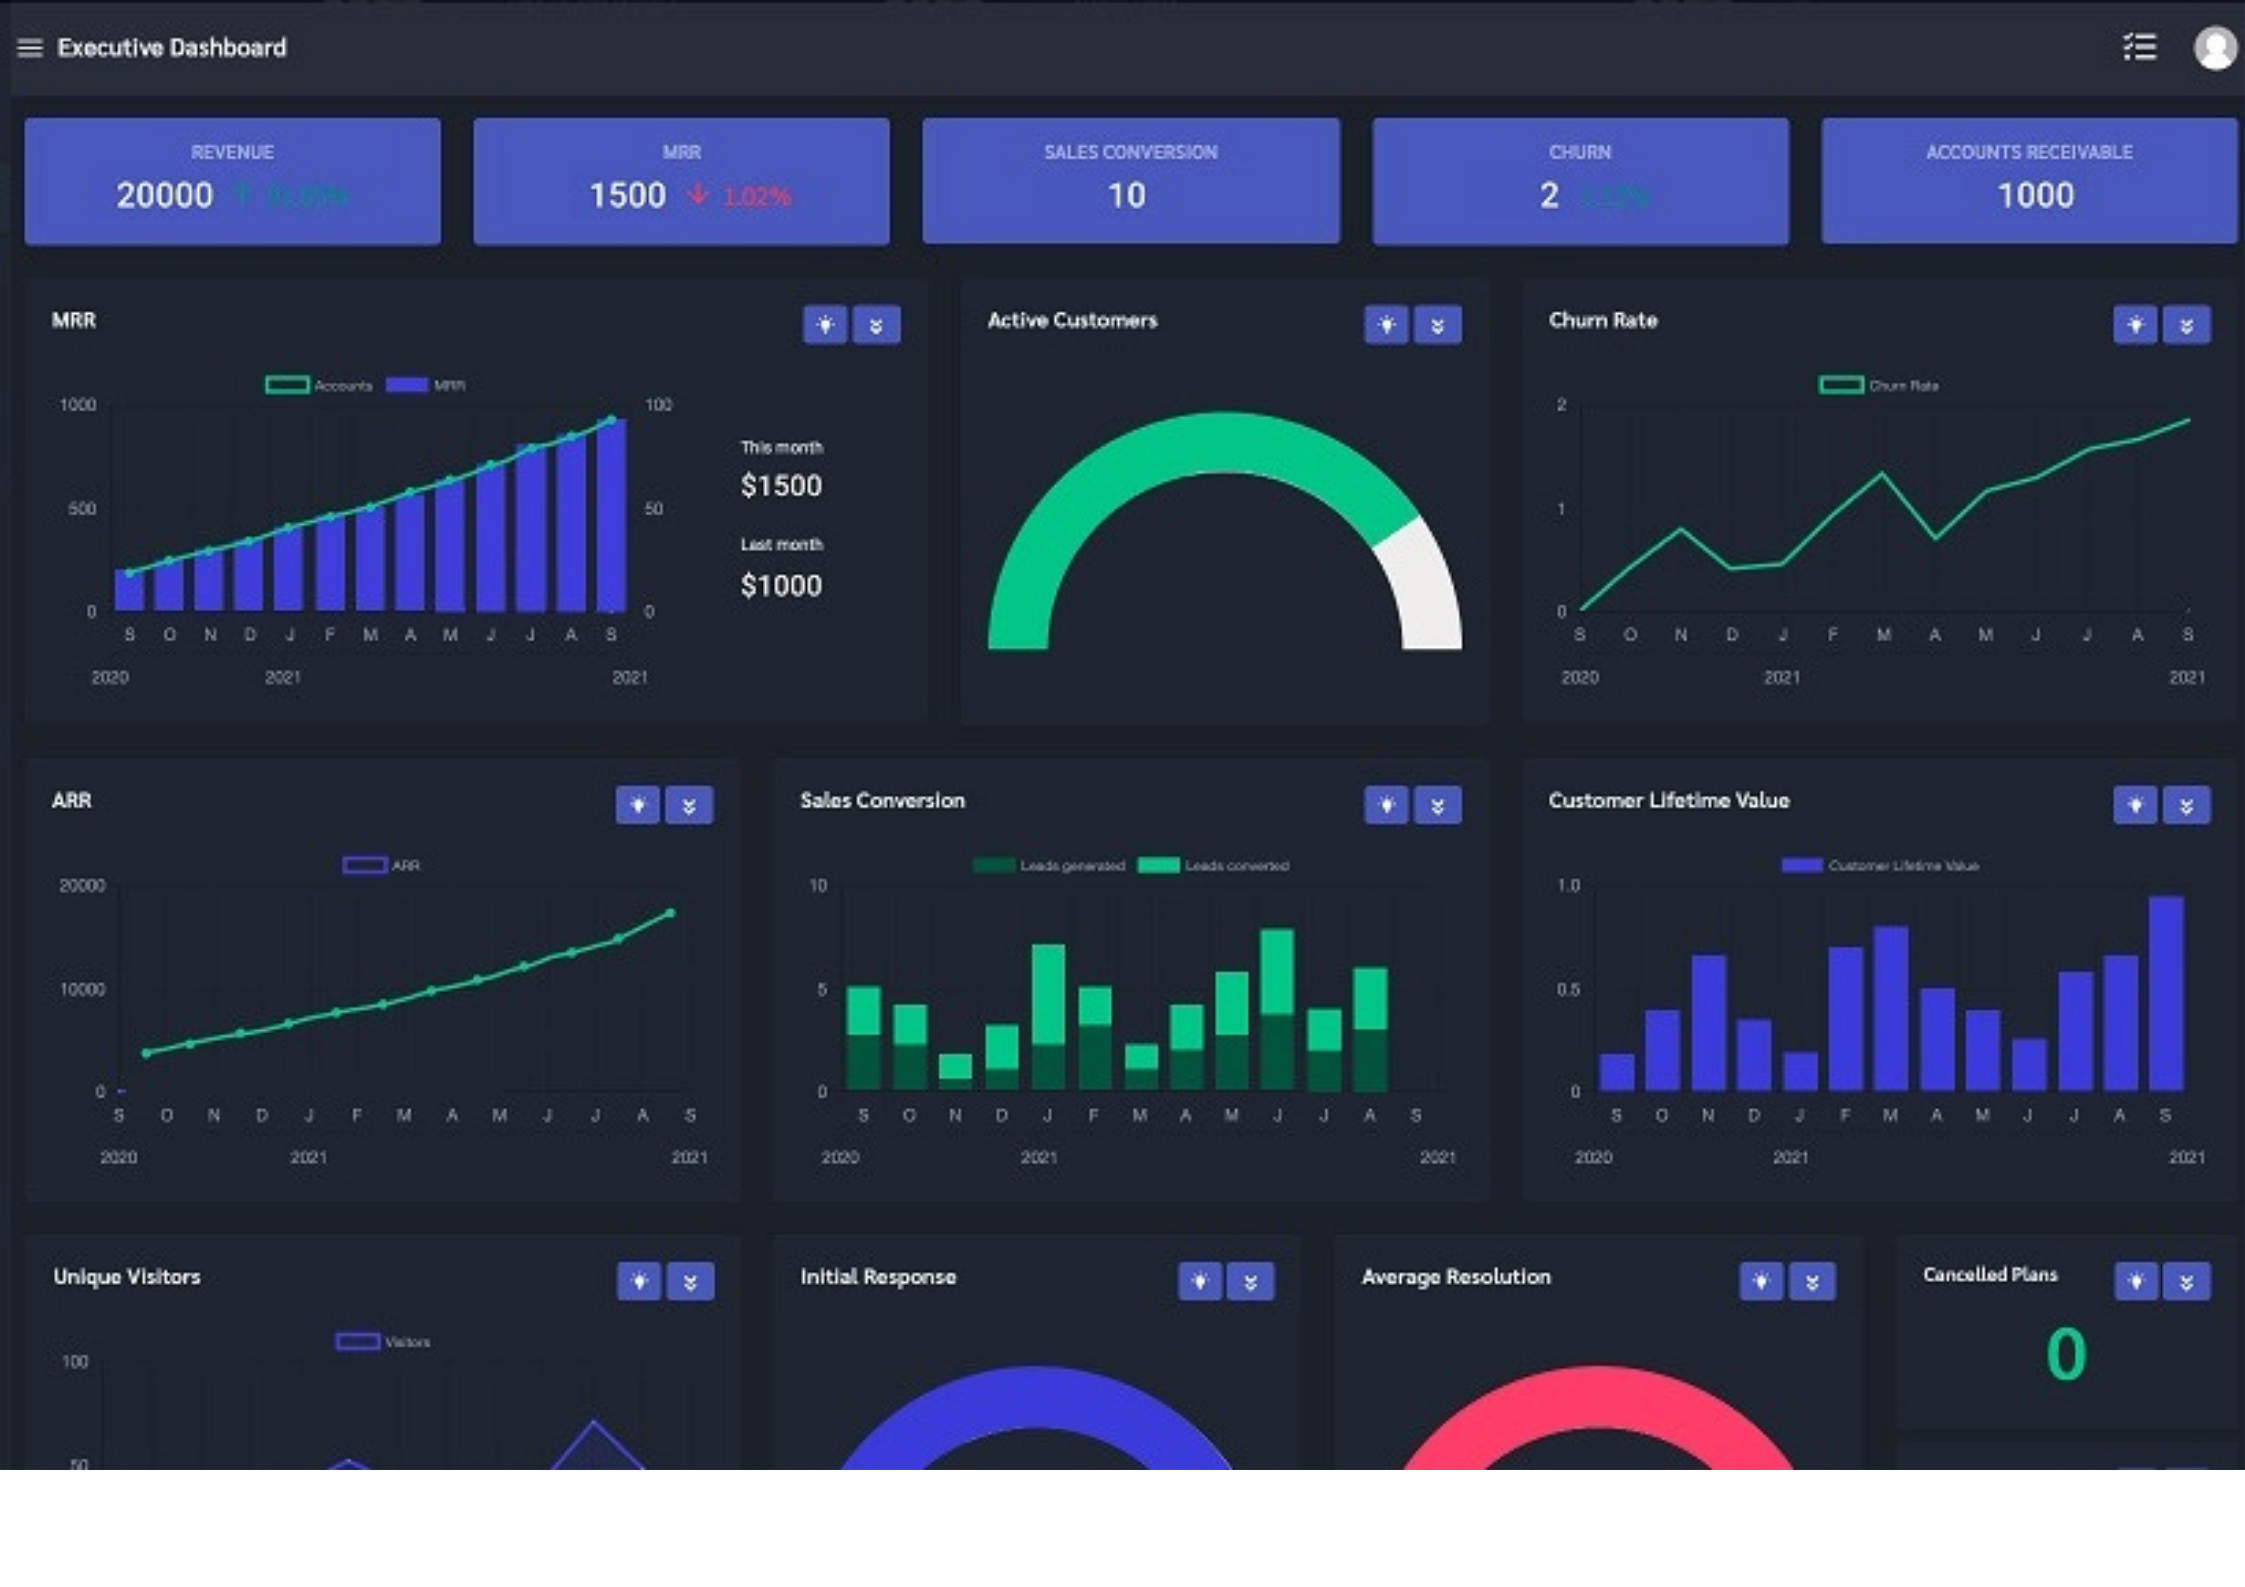
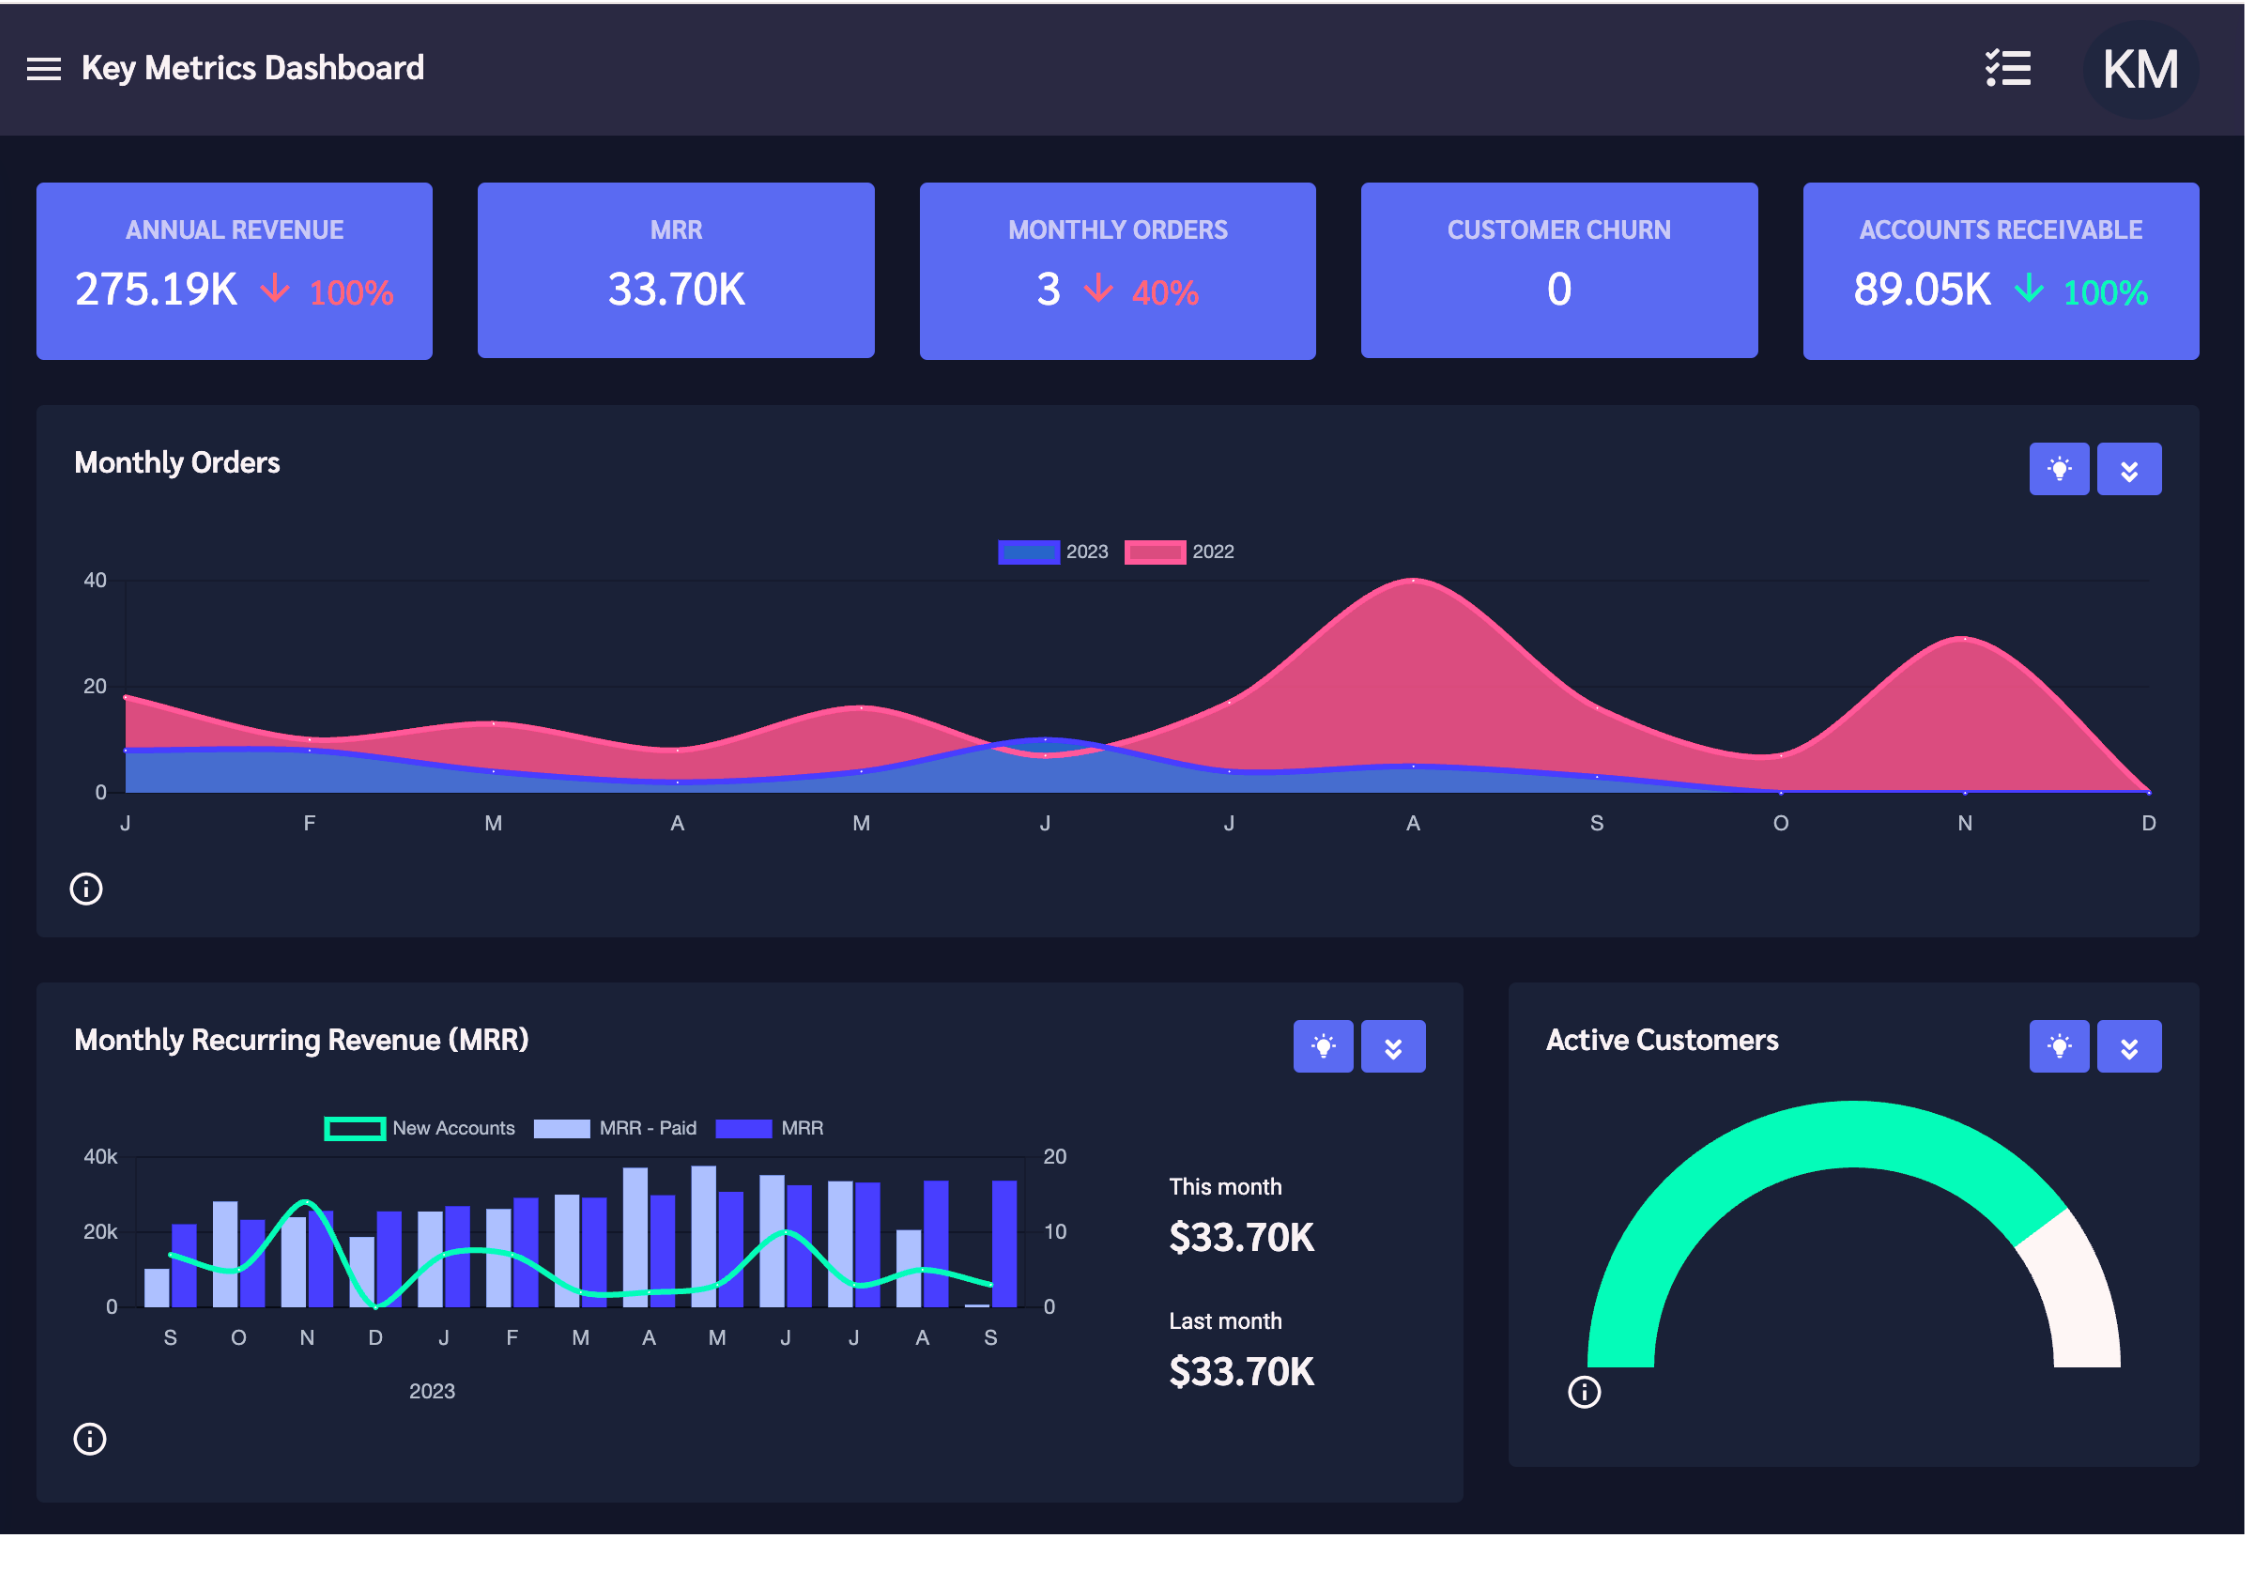
InsightDials offers seamless integration with your everyday tools, enabling you to monitor vital metrics like MRR, revenue, churn, accounts receivables,retention rate, website visitors, support KPI, LTV, and more on a single platform. Our no-code dashboards, actionable insights, and detailed drill-down features provide a real-time view of your business performance. With InsightDials, business intelligence is quick and effortless.
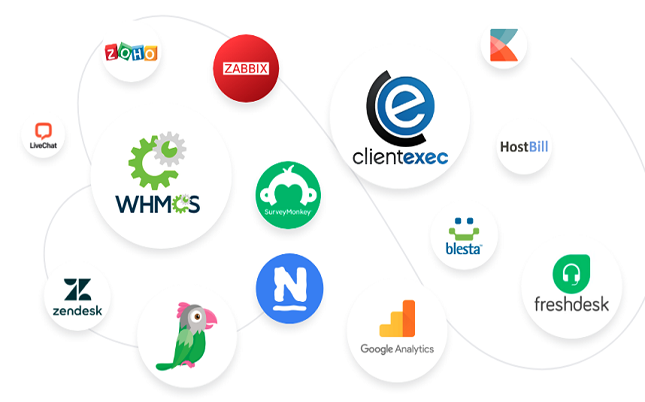
Sign UpGrowing list of integrations with popular tools. Specially for the subscription industry.
Connect your business to your data through insightful visual storytelling

Get clarity on your data by integrating your multiple data sources, visualizing the right metrics and get meaningful insights that will enable you to take the right decisions at the right time. All this can be done without any technical help. We have handpicked the key growth metrics important to your industry, that will help accelerate your business towards success and growth.
Bring scattered data from everyday tools to a central platform through simple easy data source connectors.
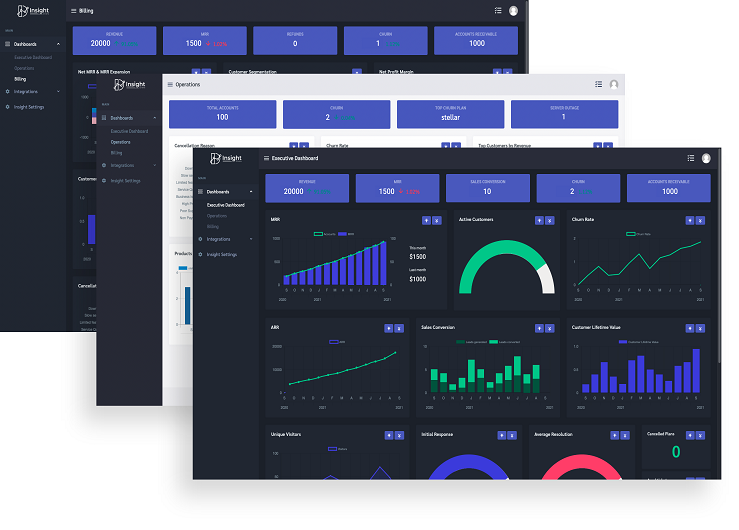
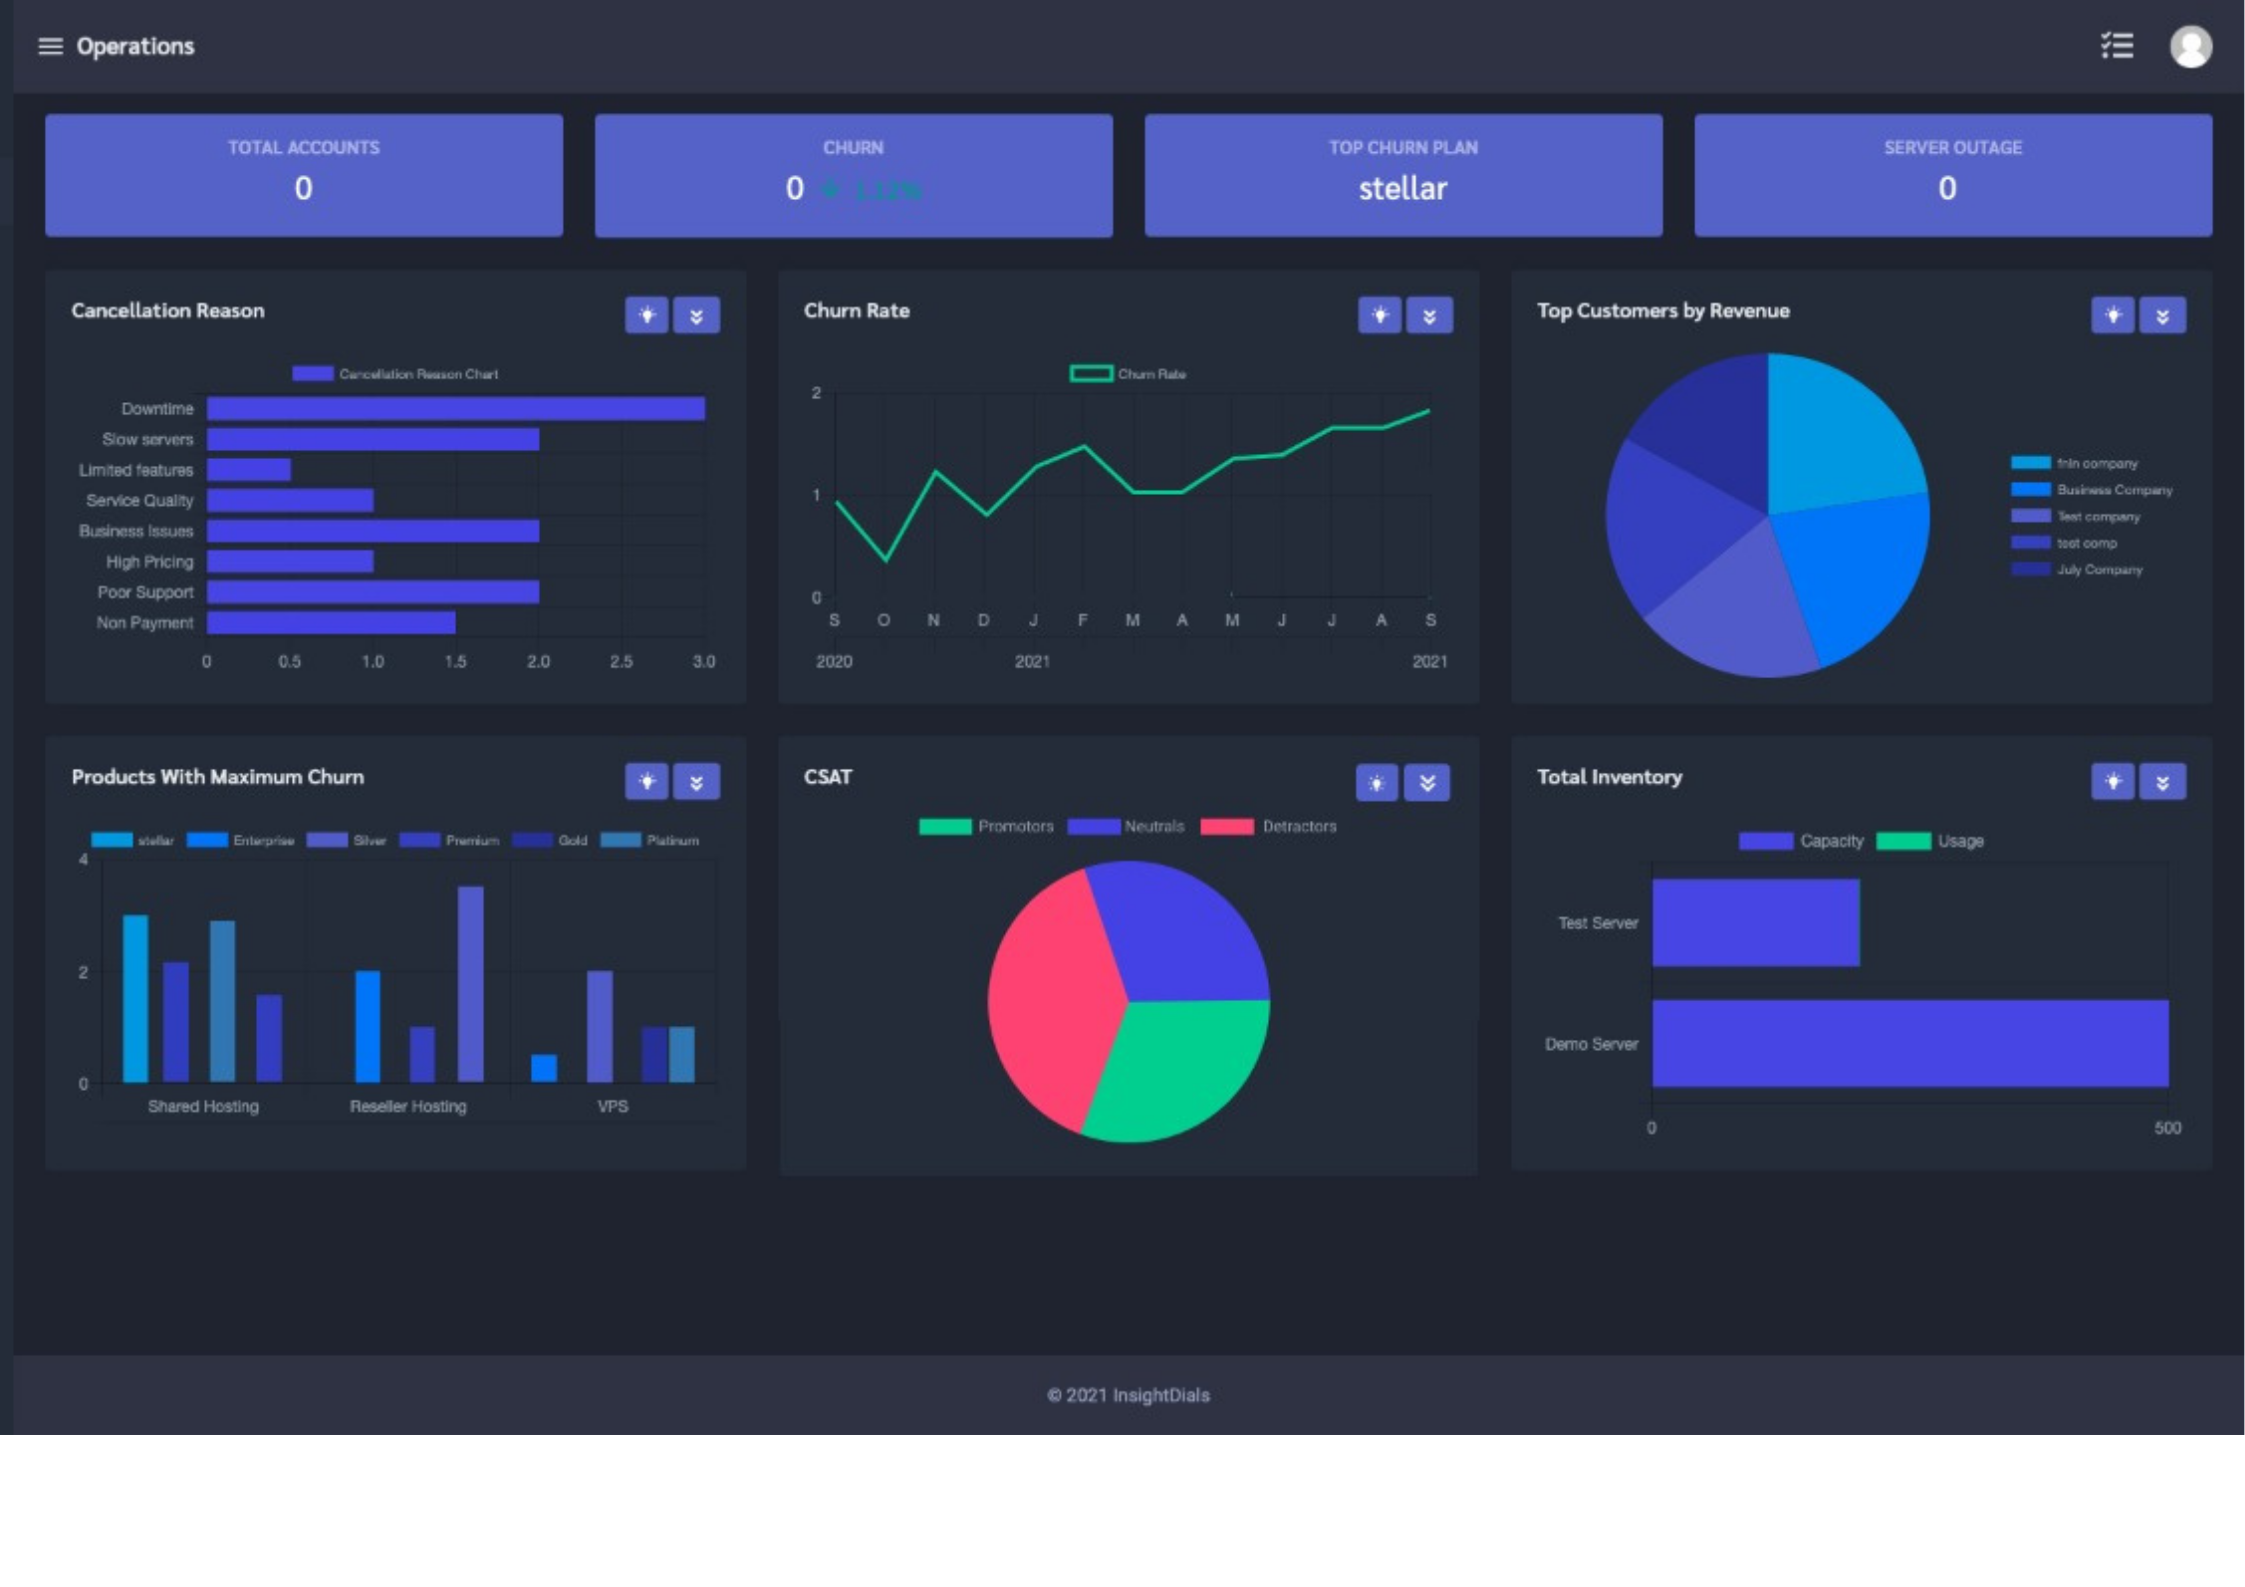
Visualize data using pre-designed dashboards, simple chats and graphs, actionable insights, and detailed drill-down.
Plug & Play dashboard for your business with easy setup in minutes. No more juggling between multiple applications and reports.
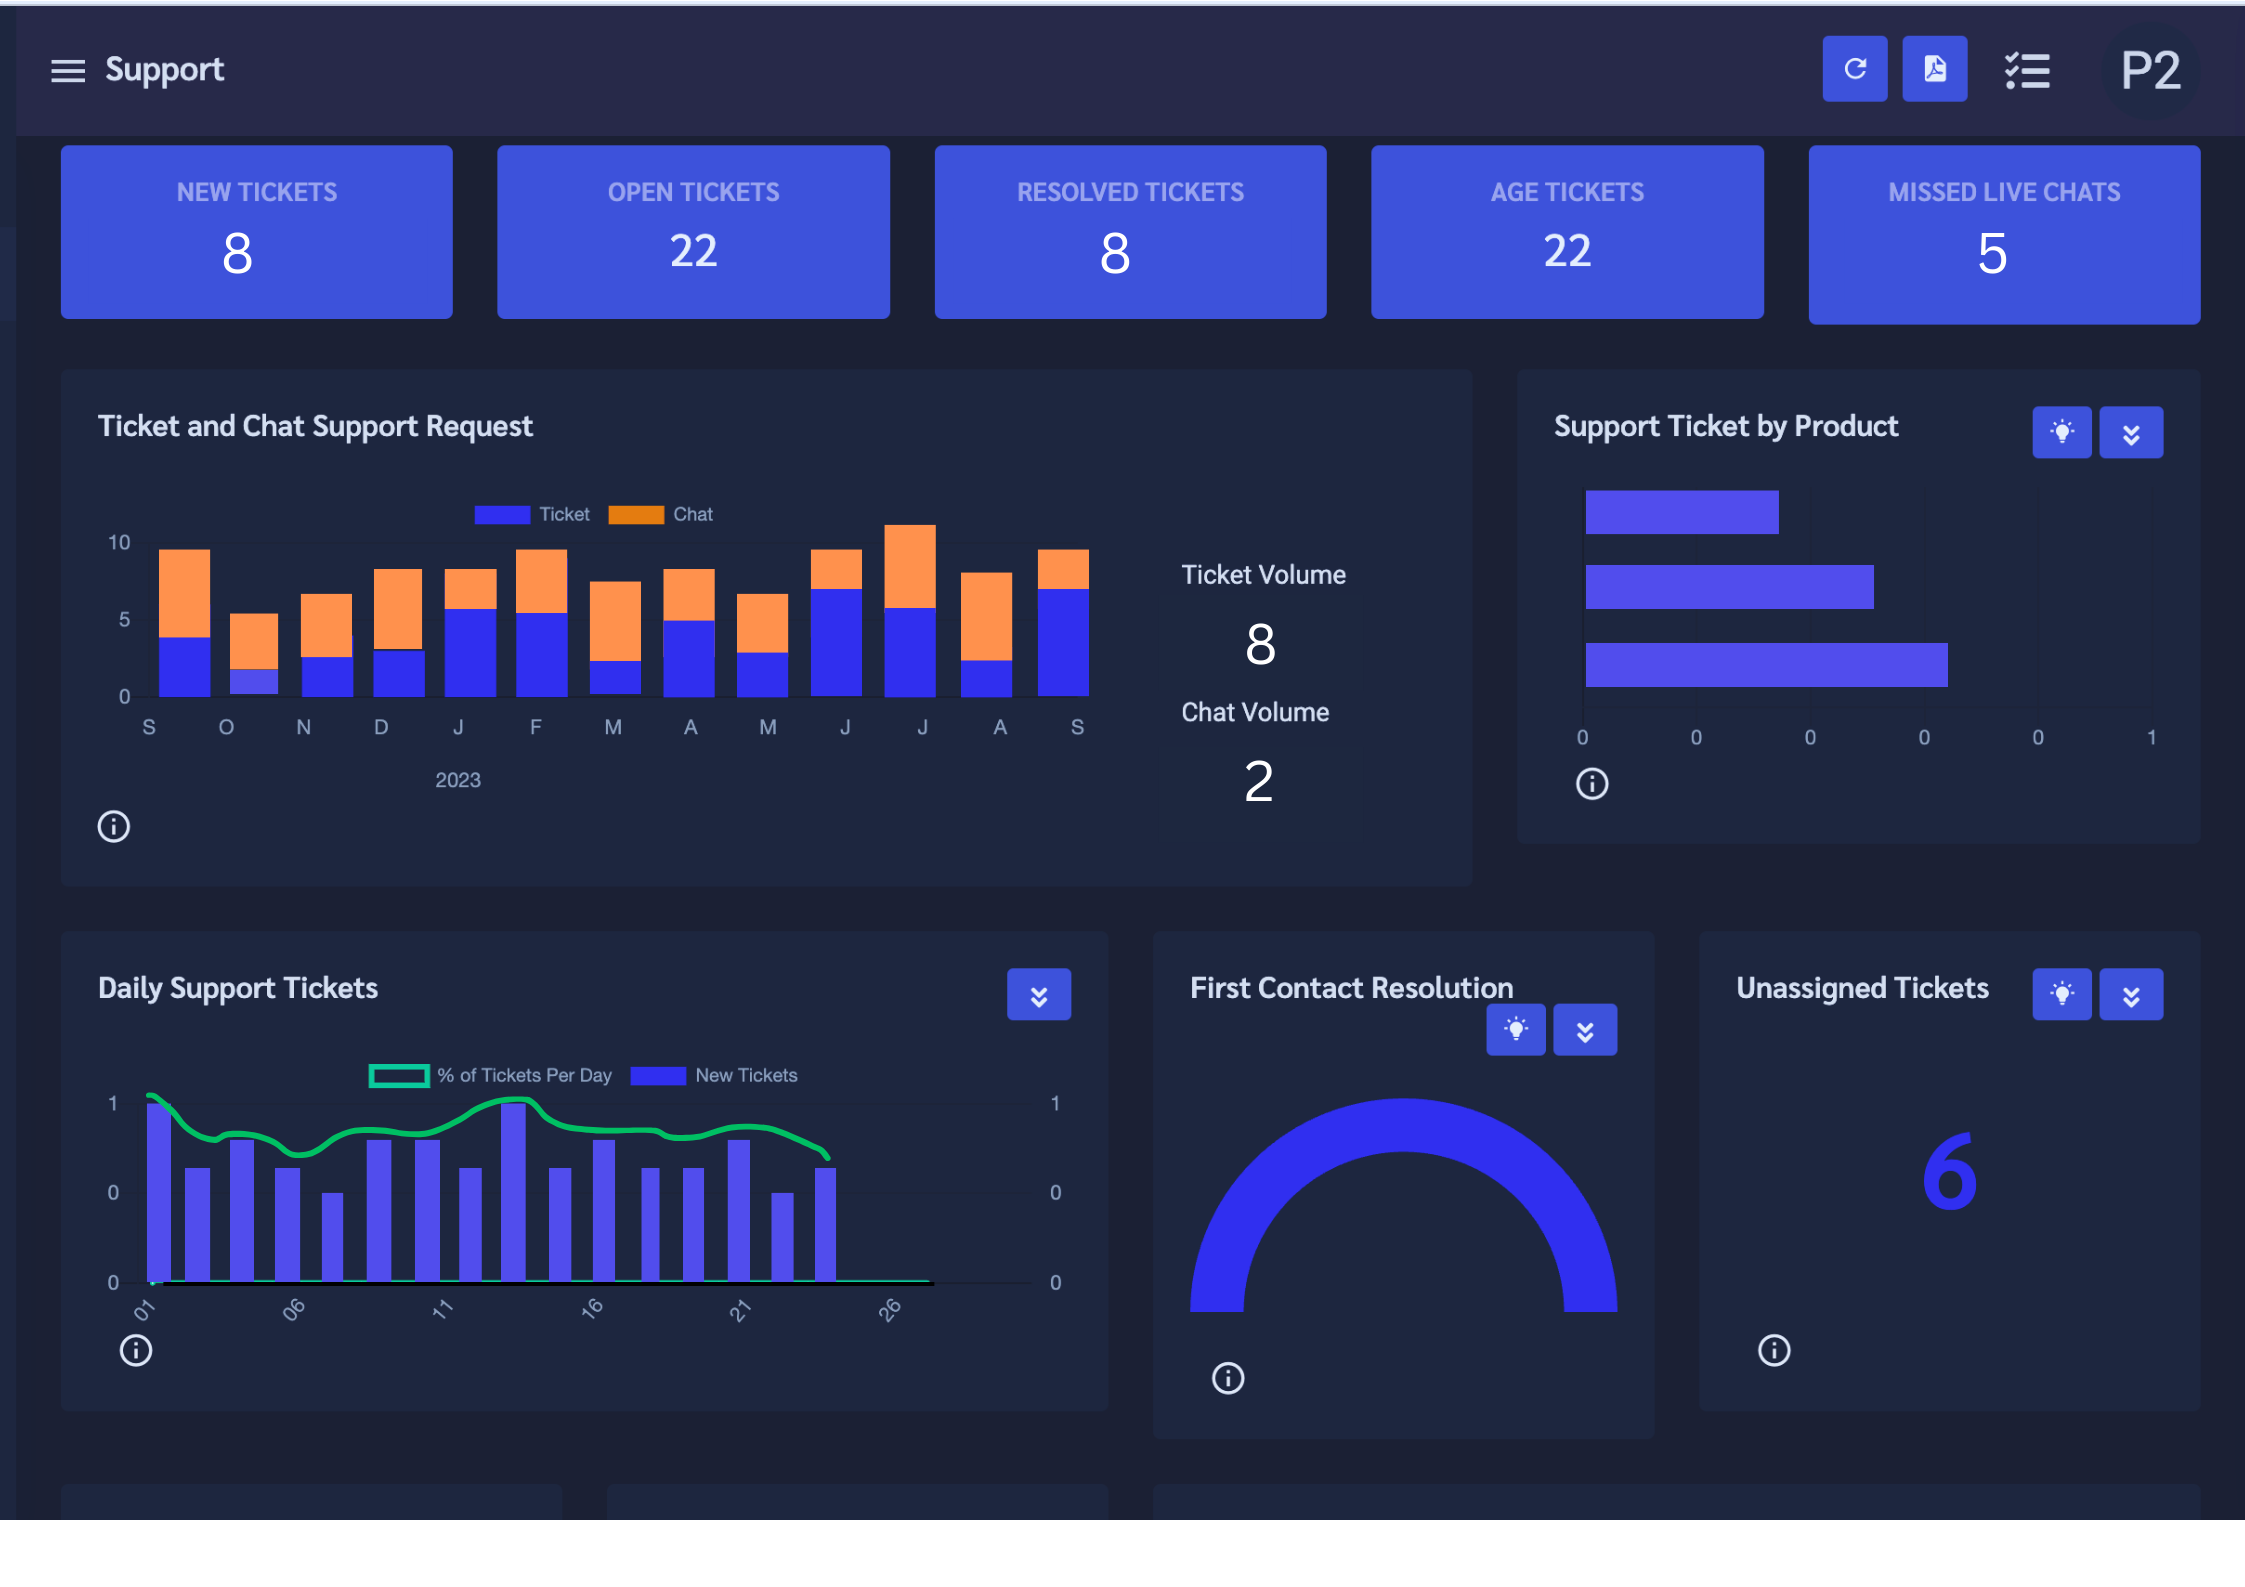
Get department-based dashboards to monitor each department's specific metrics. Executive, Billing, Operations and Support dashboards.
Get a clear picture of the story that your data is telling and the direction your business is headed with actionable insights for each metric.
Drill down and filter each metric to get in-depth details and clarity about your data and the answers to your hows and whys.
Connect your everyday tools for a unified metrics dashboard.
Increase In Topline
Reduced Churn
Increased Profit
Customer Retention
Improved Accounts Receivables
Improved Customer Satisfaction